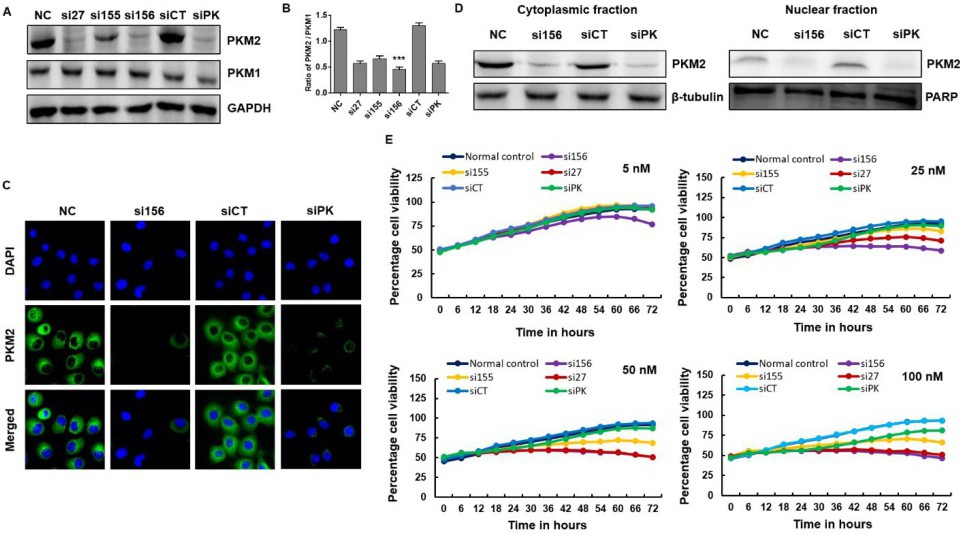
Fig. 2. Effect of siRNA transfection on PKM2 expression and cancer cell survival. (A) Expression level of PKM1 and PKM2 after transfected with indicated PKM2 siRNAs (100 nM concentration for 72 h) using GAPDH was used as an internal loading control. (B) The statistical quantification of the western blot bands of PKM2/PKM1. One-way ANOVA was used to compare the means of different groups. Differences between the means were considered to be significant at P<0.05 by using Tukey multiple comparison tests; *P<0.05, **P<0.01, and ***P<0.001 compared with the normal control cells. (C) Immunofluorescence analysis of PKM2 expression after siRNA transfection. DAPI was used for nuclear staining, and Alexa Fluor 488-conjugated goat anti-rabbit antibody was used to detect PKM2. (D) PKM2 expression level in the cytoplasmic and nuclear fractions of DU145 cells. Respective blots are shown. (E) Assessment of the effect of the transfection of different concentration (5, 25, 50, and 100 nM siRNAs upto 72 h) of the indicated siRNAs on the viability of prostate cancer DU145 cells using IncuCyte ZOOM(tm) live cell imaging system. siCT (siControl): siRNA targeting the firefly luciferase gene (negative control); siPK: commercially available siRNA targeting both PKM1 and PKM2 mRNAs (positive control); and si27, si155, and si156: experimental siRNAs targeting PKM2 mRNA.